描述
想知道你的服务器究竟需要多少堆内存?想确认你的主机提供商是否给了你付费应有的配置?其他插件(如 Essentials)虽然会提供内存统计信息,但那些可能并不是你真正关心的数据。MemCheck 能够实时显示已使用的堆内存量以及剩余的总空闲堆空间。
MemCheck 添加了一个 /mem 命令,输出以 MB 为单位的已用堆内存量、其占最大堆内存的百分比,以及总空闲堆内存量(MB)。它还提供关于 Java “元空间”(Metaspace)使用情况的统计信息。此外,还会额外显示由 Essentials 计算得出的服务器当前 TPS、CPU 负载、过去一分钟内的平均垃圾回收时间以及已加载区块的总数。
在服务器启动时,处理器(线程)数量、物理内存总量、最大堆内存、服务器视距、服务器模拟距离、Java 垃圾回收器名称以及 Java 命令行选项会被写入服务器日志文件。
这允许服务器所有者查看正在使用的内存量,并判断用于分配新对象的可用内存是太小、太大还是刚好合适。
详情
Essentials 报告的内存值直接来自 Java,并不能真正反映服务器所有者需要了解的关键信息。借助下面这张来自 Stackoverflow 的图表,解释起来会更清晰:
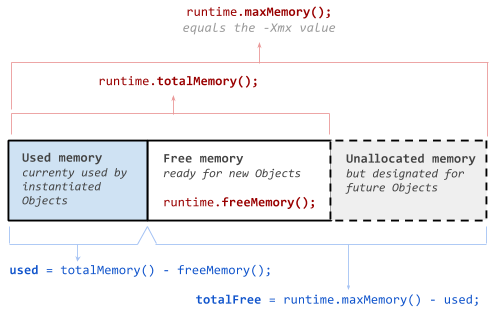
Java 提供并由 Essentials 报告的是图中红色显示的三个值。这对服务器所有者来说并非真正需要的数据。更相关的值是底部蓝色显示的两个值:used(程序当前已使用的堆内存量)和 totalFree(堆中可用于新对象的剩余内存量)。更多信息如下所示。
命令
/mem - 输出当前的内存统计信息。请注意,堆内存状态不断变化,因此随着新对象的分配或 Java 垃圾回收器的运行,你会看到数值每秒都在变化。

输出包含以下内容:
- 常规信息:
- TPS - 如果你也安装了 Essentials,将输出当前的 TPS。
- CPU - 当前 CPU 负载占所有可用核心的百分比。
- GC - 运行垃圾回收器所需的平均时间,每分钟更新一次。
- Chunks - 所有世界中已加载区块的总数。
- 堆内存:
- Heap used - 服务器当前使用的堆内存量。
- Free - 在达到最大限制之前,可用的额外堆内存量。
- Alloc - 当前已分配的堆内存量。如果你设置了小于 -Xmx 的 -Xms 值,这个数据很有用。它告诉你 Java 认为必要的堆内存量是多少。
- 元空间:
- Metaspace used - 服务器当前使用的元空间量。
- Free - 如果指定了元空间的最大值,这里会显示剩余的空闲量。
- Alloc - 当前已分配的元空间量。
权限
memcheck.mem - 使用 mem 命令所需权限。默认赋予 OP(管理员)用户。
配置
无。
杂项
本插件使用 bStats 指标系统来提供匿名使用数据。你可以通过修改 plugins/bStats/config.yml 全局退出该项功能。相关指标数据可在 查看。
Description
Want to find out how much heap space your server really needs? Want to check that your hosting provider is giving you what you paid for? Other plugins, such as Essentials, will provided memory statistics, but they're probably not what you really want to know. MemCheck provides the amount of heap used and the total amount of free heap space in real time.
MemCheck adds a /mem command which outputs the amount of used heap in MB and as a percentage of the maximum heap size, and the total free heap in MB. It also provides statistics about the Java "Metaspace" use. As a bonus, the server's current TPS as calculated by Essentials, the CPU load, the average garbage collection time in the previous minute, and the total number of loaded chunks are shown.
At startup, the number of processors (threads), total physical memory, maximum heap, server view distance, server simulation distance, Java garbage collector name(s), and Java command line options are written to the server log file.
This allows the server owner to see how much memory is being used and if the memory available for additional objects is too small, too big, or just right.
Details
The memory values reported by Essentials come directly from Java, and don't really show what a server owner needs to know. The explanation will be easier with the help of the following diagram from Stackoverflow:
Java provides, and Essentials reports, the three values shown in red. This is not really what a server owner needs. The more relevant values are the two shown in blue at the bottom: used, which is the amount of the heap currently used by the program, and totalFree, which is the amount of memory available for additional objects on the heap. More information is shown below.
Commands
/mem - This outputs the current memory statistics. Note that the heap is constantly changing, so you'll see the values change from second to second, as more objects are allocated or the Java garbage collector runs.
The output includes the following:
- General:
- TPS - If you're also running Essentials, the current TPS will be output.
- CPU - The current CPU load as a percentage of all available cores.
- GC - The average time needed to run the garbage collector, updated once per minute.
- Chunks - The total number of loaded chunks from all worlds.
- Heap:
- Heap used - The current amount of heap space used by your server.
- Free - The amount of additional heap space available, up to the maximum allowed.
- Alloc - The amount of heap space currently allocated. This is useful if you specify an -Xms values that is less than -Xmx. It tells you how much heap space Java thinks is necessary.
- Metaspace:
- Metaspace used - The current amount of Metaspace used by your server.
- Free - If a maximum value for the Metaspace has been given, this shows the amount which is free.
- Alloc - The amount of Metaspace currently allocated.
Permissions
memcheck.mem - Required to use the mem command. Defaults to op.
Configuration
None.
Miscellaneous
This plugin uses the bStats metrics system to provide anonymous usage data. You may opt-out globally by changing plugins/bStats/config.yml. The metrics are available at

 插件

 插件
 插件
 插件
 插件
 插件
评论 0
登录后参与评分
还没有评论,来抢沙发吧