? PlugTrace
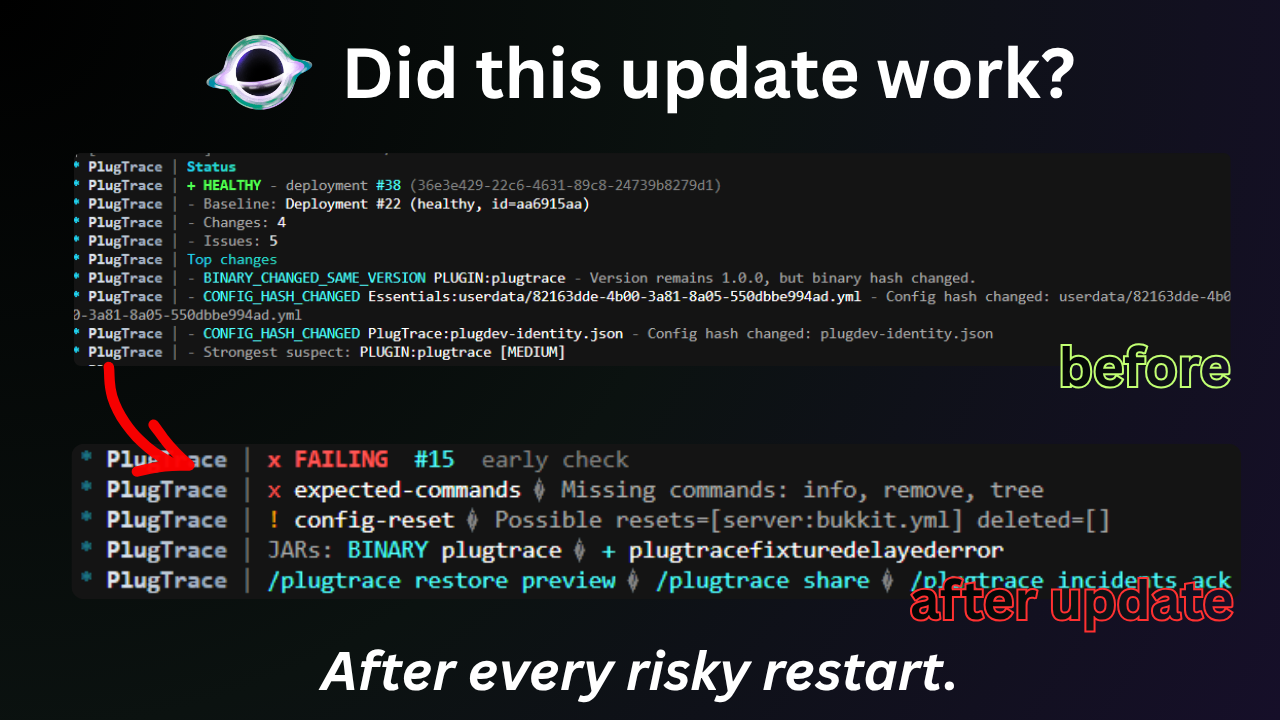
大多数服务器更新并不会以戏剧性的方式失败。服务器启动,控制台输出 Done,一切看起来都正常,直到有人发现某个命令缺失、某个插件从未启用、依赖项损坏或配置被重置。
PlugTrace 正是为了解决这种情况而构建的。它保留部署历史,在服务器启动后持续监控,将新状态与健康状态进行对比,并告诉你这次更新是否真正稳定。
它不会将 “进程仍在运行” 视为成功,而是检查你真正关心的服务器部分。
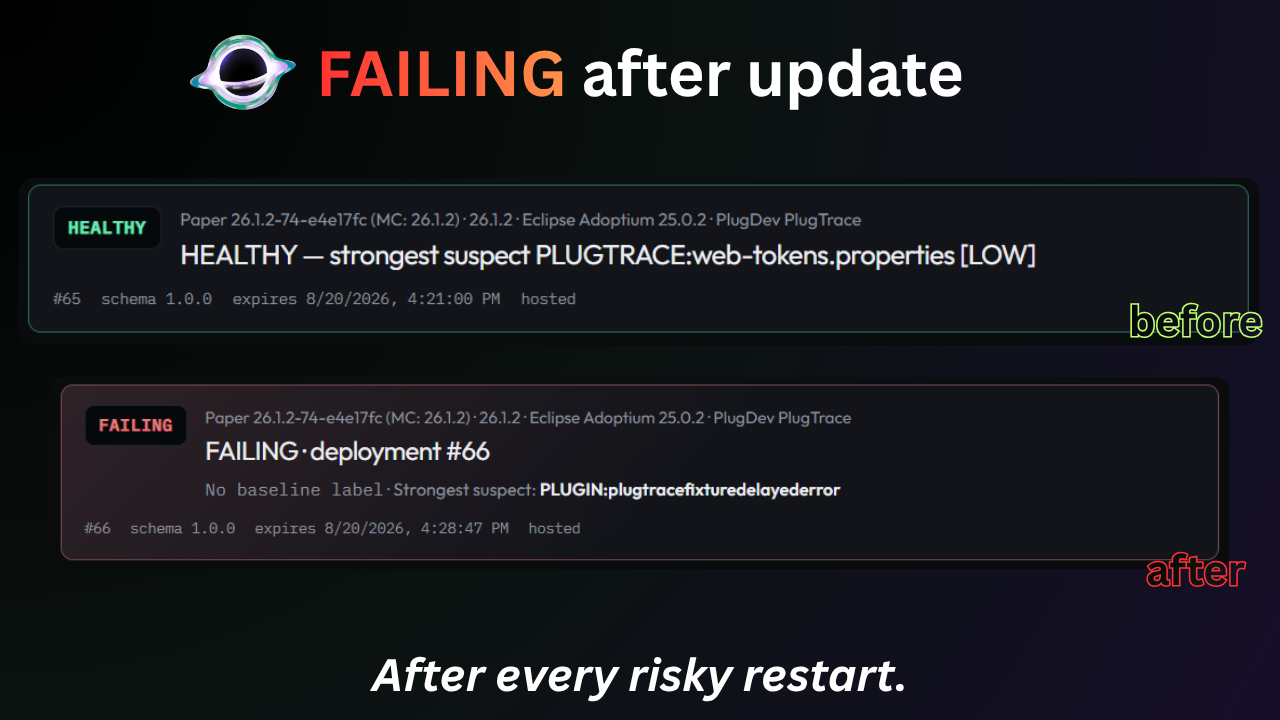
一次部署的最终状态可能是 HEALTHY(健康)、DEGRADED(降级)、FAILING(失败)或 UNKNOWN(未知),并附带导致该结果的相关证据。
⚡ spark 擅长找出哪里慢,而 PlugTrace 用于找出更新后哪里发生了变化。
? 演示
HEALTHY → 糟糕的重启 → FAILING → 差异对比 → 分享报告。
?️ 基线 (Baselines)
当你在服务器仍处于健康状态时安装 PlugTrace,它的效用最大。
在进行高风险更新之前,捕获一个希望未来部署与之对比的状态:
/plugtrace selfcheck
/plugtrace checkpoint <name>
/plugtrace expected capture
/plugtrace mark healthy
/plugtrace status
expected capture 会记录诸如插件、命令、世界和已注册服务等,这些内容应在下次重启后依然存在。
完成上述操作后,你可以更新插件、替换 JAR 文件、更改配置、升级 Paper,或者执行任何原本计划进行的维护工作。
重启之后:
/plugtrace status
这是标准的工作流程:
捕获健康状态 → 进行修改 → 重启 → 检查实际发生了什么。
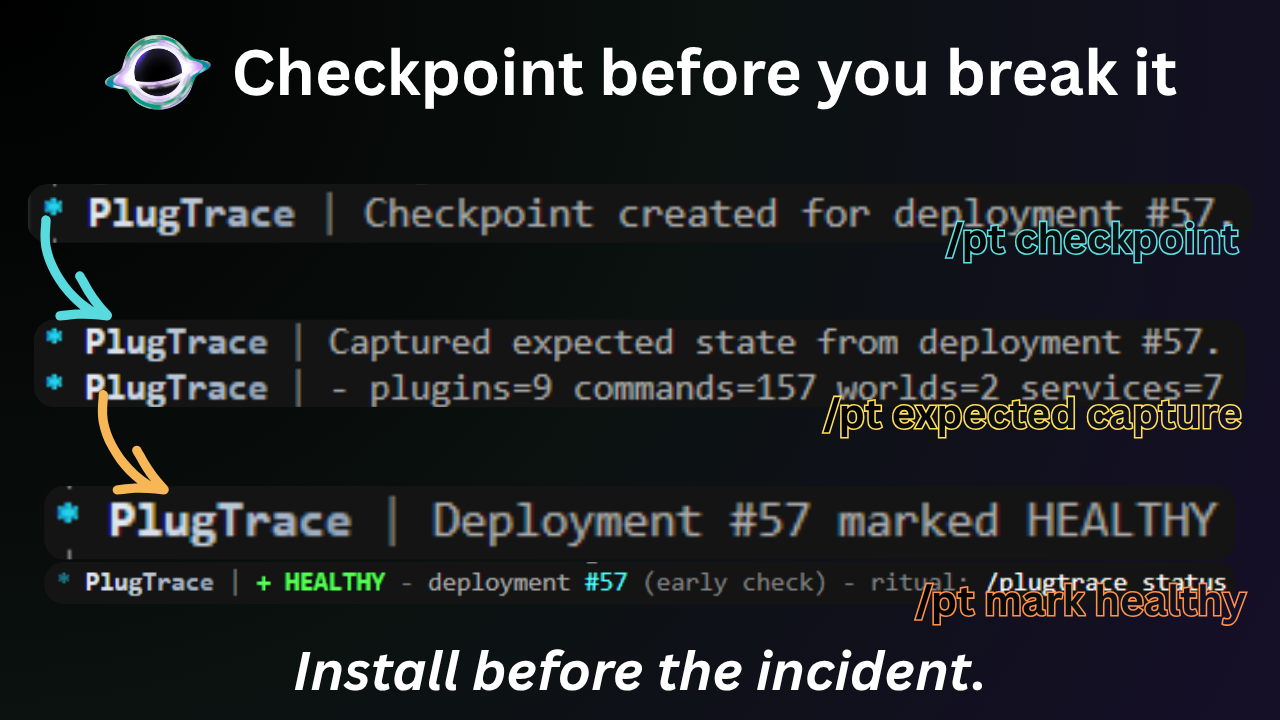
PlugTrace 的检查点是对已知良好部署的引用,而不是备份。
请保留世界、数据库、配置以及其他任何不能承受丢失的数据的正常备份。
?️ 检测
PlugTrace 主要关注那些容易被忽视的故障。
根据发生的变化,它可以揭示以下内容:
- 插件消失、禁用或无法启用
- 更新前存在的命令变得缺失
- 世界或已注册服务缺失
- 依赖项损坏或缺失
- 插件 JAR 文件被添加、移除或替换
- JAR 文件发生变化但版本号保持不变
- 配置被重置或删除的证据
- 新的严重启动问题
- 在启动后观察窗口期间出现的故障
它还保留了与部署相关的有用上下文信息:
- 失败的检查项
- 重要的 JAR 差异
- 与健康基线的变更对比
- 检测到的问题
- 事件历史
- 有证据支持的最可疑原因
最后一点是故意保守的。
PlugTrace 不应该仅仅因为某些事情看起来可疑就凭空捏造根本原因。如果可用证据不够充分,它可以返回 UNKNOWN。
⚡ 状态
对于日常使用,/plugtrace status 是主要命令。
/plugtrace status
如果你需要进一步深入调查:
/plugtrace diff
/plugtrace issues
/plugtrace incidents
/plugtrace suspect
/plugtrace deployments
PlugTrace 还会在服务器准备就绪后继续观察部署一段可配置的时间。
这很重要,因为有些问题并非发生在启动过程中——它们往往在稍后才出现。
当该观察期仍在运行时,部署状态为 OBSERVING。
一旦观察结束,PlugTrace 将确定以下状态之一:
| 状态 |
含义 |
✅ HEALTHY |
关键检查通过 |
⚠️ DEGRADED |
某些方面出现退化,但没有关键检查失败 |
❌ FAILING |
一项或多项关键检查失败 |
❓ UNKNOWN |
没有足够的可靠证据来做出明确判断 |
? 分享
当你需要其他管理员、插件开发者或主机提供商的帮助时,转储整个控制台通常不是最佳选择。
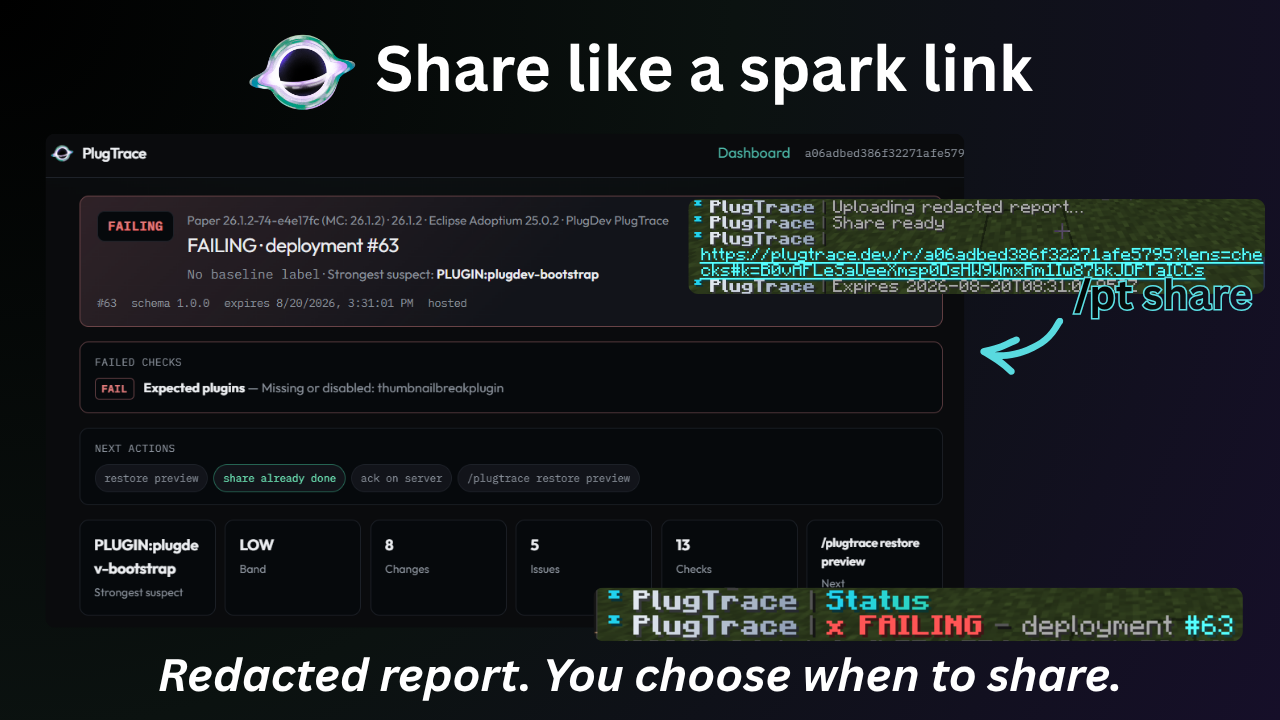
PlugTrace 可以围绕此次部署生成一份报告,让查看者在同一位置获得失败的检查项、相关变更、事件证据以及周围的上下文信息。
先预览一下:
/plugtrace report preview
如果你决定分享它:
/plugtrace share
这将创建一个托管的 PlugTrace 报告链接,你可以通过 Discord、GitHub 或支持工单发送该链接。
? 隐私
托管报告是可选的,且不会自动上传任何内容。
检查点、验证、部署历史、本地报告和本地仪表板都保留在你的服务器上。
托管报告仅在管理员显式运行以下命令时才会上传:
/plugtrace share
在上传之前,报告会被脱敏并加密。
托管服务存储加密的报告数据,而解密密钥则保留在完整分享 URL 的 #k=... 片段中。
任何拥有完整 URL 的人都可以打开报告,因此请将其视为私密信息。
托管报告会自动过期;默认有效期为 14 天。
如果你配置了 Discord Webhook,PlugTrace 还可以向其中发送脱敏的部署摘要。默认未配置任何 Webhook,且 Discord 通知不会自动创建或上传托管报告。
更多详情:
? PlugTrace Privacy
? 本地优先
你不需要 PlugTrace 账号,正常使用也不需要托管报告服务。
命令、验证、部署历史、本地报告和可选的 Web UI 均在本地运行。
默认情况下,仪表板绑定在:
http://127.0.0.1:9465
它提供了一种更清晰的方式来浏览部署、变更、检查、事件、可疑项、检查点和恢复状态。
如果你选择将仪表板暴露到本地网络之外,请确保通过 TLS 和反向代理对其进行安全保护。
↩️ 恢复
当存在所需的本地证据时,PlugTrace 可以准备一个保守的恢复计划:
/plugtrace restore preview
/plugtrace restore stage
/plugtrace restore finalize
/plugtrace restore verify
/plugtrace restore complete
恢复流程刻意采用“先审查”模式。
目标是基于证据恢复最小的相关变更,而不是盲目地将整个服务器回滚。
你可以使用以下命令中止正在进行的恢复:
/plugtrace restore abort
PlugTrace 不会自动恢复世界或数据库,也不会使热重载变得安全。
请配合使用适当的备份。
? 安装
将 PlugTrace 放入 plugins/ 目录,执行干净重启,然后检查一切是否正常加载:
/plugtrace selfcheck
一旦服务器处于健康状态,请在下次高风险更新之前捕获该基线。
PlugTrace 完全在服务器端运行,因此玩家无需安装任何内容。
兼容性
- Paper
- Purpur
- Folia
- Spigot
- 无需客户端模组
- 仅服务器端
- 使用你的服务器软件所需的 Java 版本
安装前,请查看你所下载版本的兼容性信息。
? 免费且开源
PlugTrace 在 Apache License 2.0 下免费提供并开源。
没有必需的账号、付费版或必需的云服务。
托管报告在你希望共享事件时会提供;核心的部署跟踪和验证工作流并不依赖它们。
? 观看演示
? 网站
? 文档
? 源代码
? 问题追踪器
? Discord
☕ Ko-fi
? 使用统计
PlugTrace 使用 bStats 进行匿名使用指标收集。

? PLUG Labs
PlugTrace 是在 PLUG Labs 下构建的,这也是其支持、创意、测试、错误报告、开发讨论和发布新闻所在的地方。
? 加入 PLUG Labs Discord
? 提交问题
? 阅读文档
? 观看 PlugTrace 的实际操作
? PlugTrace
Most server updates don't fail in a dramatic way. The server starts, the console reaches Done, and everything looks normal until someone notices a command is missing, a plugin never enabled, a dependency broke, or a config got reset.
PlugTrace is built for that exact situation. It keeps a history of deployments, watches the server after startup, compares the new state against a healthy one, and tells you whether the update actually held together.
Instead of treating "the process is still running" as success, it checks the parts of the server you actually care about.
A deployment can end up as HEALTHY, DEGRADED, FAILING, or UNKNOWN, with the evidence that led to that result.
⚡ spark is great for finding what is slow. PlugTrace is for finding what changed after an update.
? Demo
HEALTHY → bad restart → FAILING → diff → share report.
?️ Baselines
PlugTrace is most useful when you install it while the server is still healthy.
Before a risky update, capture the state you want future deployments to be compared against:
/plugtrace selfcheck
/plugtrace checkpoint <name>
/plugtrace expected capture
/plugtrace mark healthy
/plugtrace status
expected capture records things such as plugins, commands, worlds, and registered services that should still be there after the next restart.
Once that's done, update your plugins, replace JARs, change configs, upgrade Paper, or do whatever maintenance you were going to do anyway.
After the restart:
/plugtrace status
That's the normal workflow:
capture a healthy state → make the change → restart → check what actually happened.
A PlugTrace checkpoint is a reference to a known-good deployment, not a backup.
Keep normal backups for worlds, databases, configs, and anything else you cannot afford to lose.
?️ Detection
PlugTrace is mainly interested in the failures that are easy to miss.
Depending on what changed, it can surface things such as:
- plugins disappearing, disabling, or failing to enable
- commands that existed before the update going missing
- missing worlds or registered services
- broken or missing dependencies
- plugin JARs being added, removed, or replaced
- a JAR changing while keeping the same version number
- config reset or deletion evidence
- new severe startup issues
- failures that appear during the post-start observation window
It also keeps the useful context around the deployment:
- failed checks
- important JAR differences
- changes from the healthy baseline
- detected issues
- incident history
- the strongest suspect supported by the evidence
That last part is intentionally conservative.
PlugTrace isn't supposed to invent a root cause just because something looks suspicious. If the available evidence isn't strong enough, it can return UNKNOWN instead.
⚡ Status
For day-to-day use, /plugtrace status is the main command.
/plugtrace status
If you need to dig further:
/plugtrace diff
/plugtrace issues
/plugtrace incidents
/plugtrace suspect
/plugtrace deployments
PlugTrace also keeps observing the deployment for a configurable period after the server becomes ready.
This matters because some problems don't happen during startup itself — they appear shortly afterward.
While that observation is still running, the deployment is OBSERVING.
Once it finishes, PlugTrace settles on one of these states:
| State |
Meaning |
✅ HEALTHY |
Critical checks passed |
⚠️ DEGRADED |
Something regressed, but no critical check failed |
❌ FAILING |
One or more critical checks failed |
❓ UNKNOWN |
There isn't enough reliable evidence to make a confident call |
? Sharing
When you need help from another admin, a plugin developer, or a host, dumping the entire console usually isn't ideal.
PlugTrace can build a report around the deployment instead, so the person looking at it gets the failed checks, relevant changes, incident evidence, and surrounding context in one place.
Preview it first:
/plugtrace report preview
If you decide to share it:
/plugtrace share
That creates a hosted PlugTrace report link you can send through Discord, GitHub, or a support ticket.
? Privacy
Hosted reports are optional and nothing is uploaded automatically.
Checkpoints, verification, deployment history, local reports, and the local dashboard stay on your server.
A hosted report is uploaded only when an administrator explicitly runs:
/plugtrace share
Before upload, the report is redacted and encrypted.
The hosted service stores the encrypted report data, while the decryption key remains in the #k=... fragment of the full share URL.
Anyone with the complete URL can open the report, so treat it as private.
Hosted reports expire automatically; the default lifetime is 14 days.
PlugTrace can also send a redacted deployment digest to a Discord webhook if you configure one. No webhook is configured by default, and Discord notifications do not automatically create or upload a hosted report.
More details:
? PlugTrace Privacy
? Local-first
You don't need a PlugTrace account, and the hosted report service is not required for normal use.
Commands, verification, deployment history, local reports, and the optional web UI all work locally.
The dashboard binds to:
http://127.0.0.1:9465
by default and gives you a cleaner way to browse deployments, changes, checks, incidents, suspects, checkpoints, and recovery state.
If you choose to expose the dashboard outside localhost, secure it properly behind TLS and a reverse proxy.
↩️ Restore
When the required local evidence exists, PlugTrace can prepare a conservative restore plan:
/plugtrace restore preview
/plugtrace restore stage
/plugtrace restore finalize
/plugtrace restore verify
/plugtrace restore complete
The restore flow is deliberately review-first.
The goal is to recover the smallest relevant change supported by the evidence rather than blindly rolling the whole server backward.
You can abort an in-progress restore with:
/plugtrace restore abort
PlugTrace does not automatically restore worlds or databases, and it does not make hot reloads safe.
Use proper backups alongside it.
? Install
Drop PlugTrace into plugins/, perform a clean restart, then check that everything loaded correctly:
/plugtrace selfcheck
Once the server is in a healthy state, capture that baseline before the next risky update.
PlugTrace runs entirely server-side, so players do not need to install anything.
Compatibility
- Paper
- Purpur
- Folia
- Spigot
- No client mod required
- Server-side only
- Uses the Java version required by your server software
Check the compatibility information on the version you're downloading before installing.
? Free & open source
PlugTrace is free and open source under the Apache License 2.0.
There is no required account, paid edition, or required cloud service.
Hosted reports are there when you want to share an incident; the core deployment tracking and verification workflow does not depend on them.
? Watch the demo
? Website
? Documentation
? Source Code
? Issue Tracker
? Discord
☕ Ko-fi
? Usage Stats
PlugTrace uses bStats for anonymous usage metrics.
? PLUG Labs
PlugTrace is built under PLUG Labs, which is also where its support, ideas, testing, bug reports, development discussion, and release news live.
? Join the PLUG Labs Discord
? Open an issue
? Read the docs
? Watch PlugTrace in action


 插件

 插件
 插件
 插件
 插件
 插件
评论 0
登录后参与评分
还没有评论,来抢沙发吧